- Company
- Products
- Brands
- Imada
- Koken
- Kanon
- Tohnichi
- Cedar
- BIX
- Niigata Seiki
- Imada Seisakusho
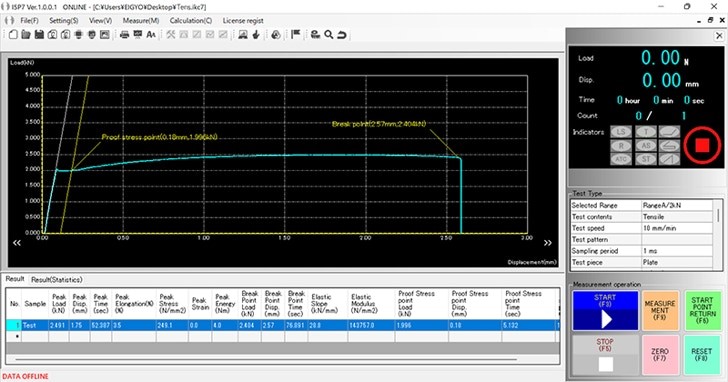
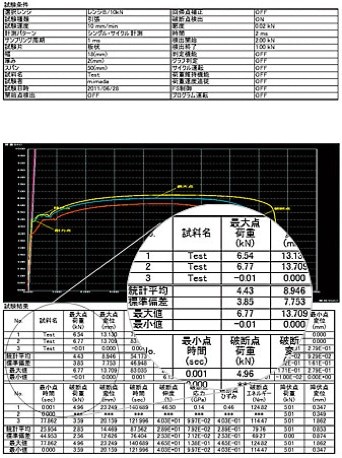
- Universal Testing Machine – Imada Seisakusho
- Special Attachments
- Special Specification Testing Machine
- Torque Tester
- Push Pull Stand – Imada Seisakusho
- Packing Compression Testing Machine – Imada Seisakusho
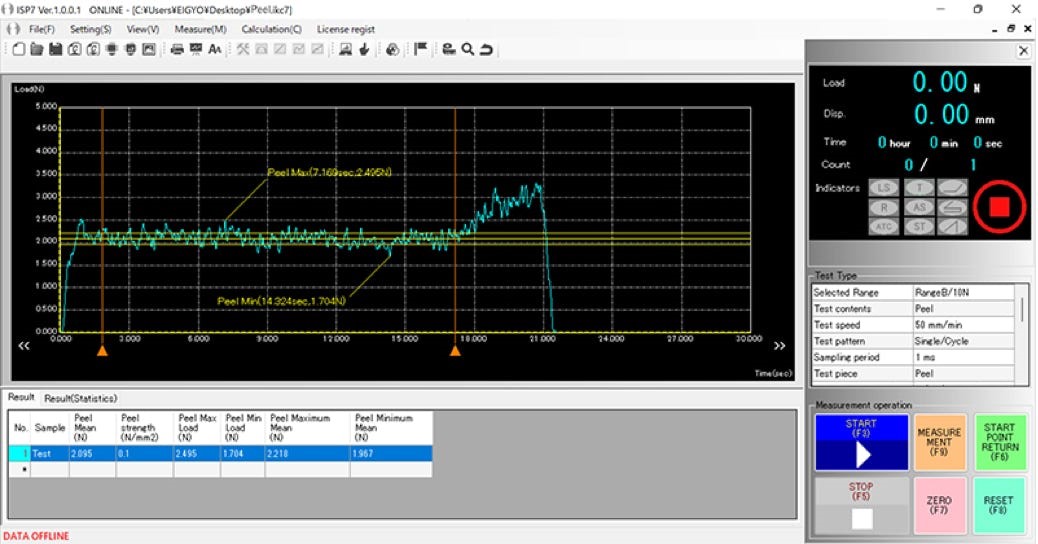
- High Speed Peeling Testing Machine – Imada Seisakusho
- Flexure Testing Machine – Imada Seisakusho
- Spiral Spring Durability Testing Machine – Imada Seisakusho
- Leather Testing Equipment & Machine – Imada Seisakusho
- Lamp Socket Pull & Insert Testing Machine – Imada Seisakusho
- Crash Testing | Seat Belt Collision Testing – Imada Seisakusho
- Spring Testing Machine – Imada Seisakusho
- Gedore
- Iijima Electronics
- Otsuka
- Industry
- Automobile
- Airline
- Chemicals / Raw Materials
- Cosmetics / FMCG
- Construction / Furniture
- Electronics / Semiconductors
- Energy
- Ergonomics / Sporting Goods
- Food & Beverages
- Industry Machinery / Parts
- Jewelry & Watch
- Musical Instruments
- Occupational Training
- Packaging / Containers / Paper
- Pharmaceutical & Medical Equipment
- Textile & Clothing
- Toy & Nursery
- Intraocular Lens (IOL)
- Services
- Contact